Partners: space4environment
Use case objective
Climate change poses several challenges to cities, such as droughts, urban heat waves, changing precipitation patterns, floods and (peri-)urban biodiversity loss. These impacts are interrelated with factors like land use activities around cities and the socio-economic setting. Datasets on these factors are available, but they are complex to integrate and analyze due to their heterogeneity, format and quality. The goal of UC1 is to harmonize the diverse datasets into structured data cubes and provide a comprehensive “toolkit” for their analysis.
Potential applications
The data analysis toolkit should support European institutions, local policy makers and scientists to make well-informed decisions when addressing climate change’s multifaceted impacts.
One European data cube collects indicators from different domains for many cities. It can be used to identify cities with similar characteristics, assess climate change impacts across the continent and the influence of different factors on cities adaptation capacity.
On the local scale, we work closely with city municipalities to create city cubes and define specific goals. For example, study the effects of various environmental variables on perceived temperature. Where possible, solutions developed for one city will be scaled to other cities.

The data cubes
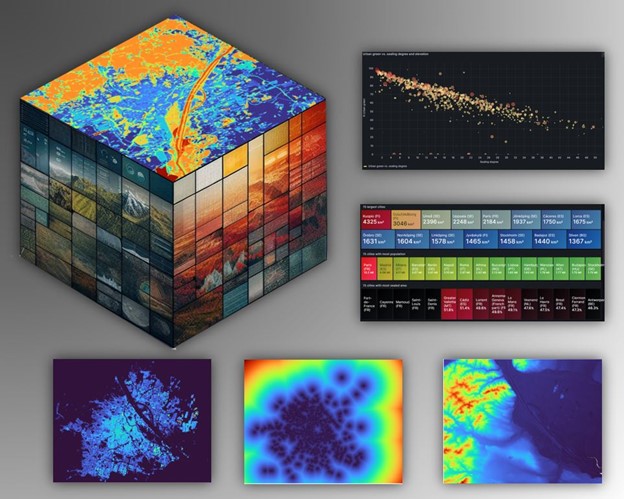
The European data cube contains data from the climate, land and socio-economic domains. Clustering analysis has been employed to discover cities that are similar with respect to the impact of climate change and their adaptation strategies.
The data set was published in Zenodo: https://doi.org/10.5281/zenodo.11034578.
To understand the effect of covariates on perceived temperature, the first step is to have an accurate measure. We aim at achieving it by integrating in the city cube weather station data. Where no station is available, the values will be predicted based on land surface temperature, DEM and other variables.
Workflow
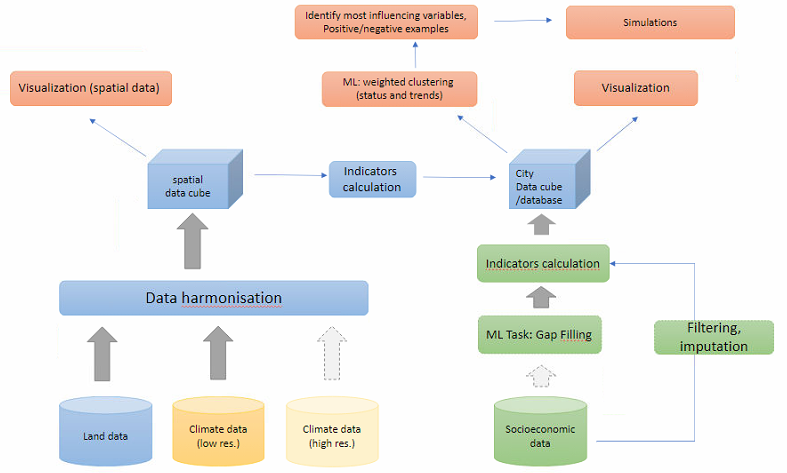
The figure below shows the workflow we will follow. We will perform a cluster analysis of EU cities using data from the climate, land cover/land use and socio-economic domains (figure 1). This initiative will be executed on dual fronts: at the European level, encompassing approximately 800 cities, and at the local level, involving a focused approach on selected few test cities.

The analysis allows to identify cities with similar characteristics, assess different climate change impacts across the continent and the influence of different factors on cities adaptation capacity. It can also help identify positive examples and best practices which could inspire other cities. The created information can be provided in a tailor-made format such as short factsheets and visualizations for non-technical users or more specific maps, visualizations and even the underlying data for researchers or data engineers.
