The city of Vienna boasts an extensive collection of geospatial datasets available for public access such as the open data platform and open GIS platform:
These datasets cover a broad range of spatial and statistical information, including 2D/3D building models, protected areas, tree cadastre, population statistics, land use and land cover information, digital elevation and surface models, and climate data, among others.
Despite the richness of these datasets, analysing them collectively poses significant challenges due to their lack of harmonization. The datasets come in various formats (vector lines, points, raster, tables), resolutions, and reference units (districts, grid cells, etc.), and different description of the content (different names for the same land use, …). This inhomogeneity complicates efforts to cleanly integrate and analyse the data.
To address this issue, our team has developed a method to harmonize these unequal datasets by converting them into a unified gridded format, thereby creating a comprehensive and integrated data cube. This harmonized data cube is pivotal for assessing the effects of different urban environments on the genetics of Drosophila (fruit flies) as part of a collaborative project between UC1 and UC3.
The data cube will also be invaluable for future urban adaptation studies. Among the datasets used in this project are:
Distance to Organic Waste Bins:
This map illustrates the proximity to the nearest bin for each pixel.
Sealing Degree:
This map shows the percentage of sealed surfaces for each pixel.
Building Footprint Area:
This map represents the total area of buildings within a 100m grid.
To achieve this harmonization, we employed a rasterization approach. This involves transferring underlying information to a selected 100m grid. For instance, the “building footprints” vector dataset was pre-processed and converted into a gridded format by summarizing the total building area within each 100m x 100m cell. Similarly, for other data types, such as air temperature, we calculated the average air temperature for each 100m cell.
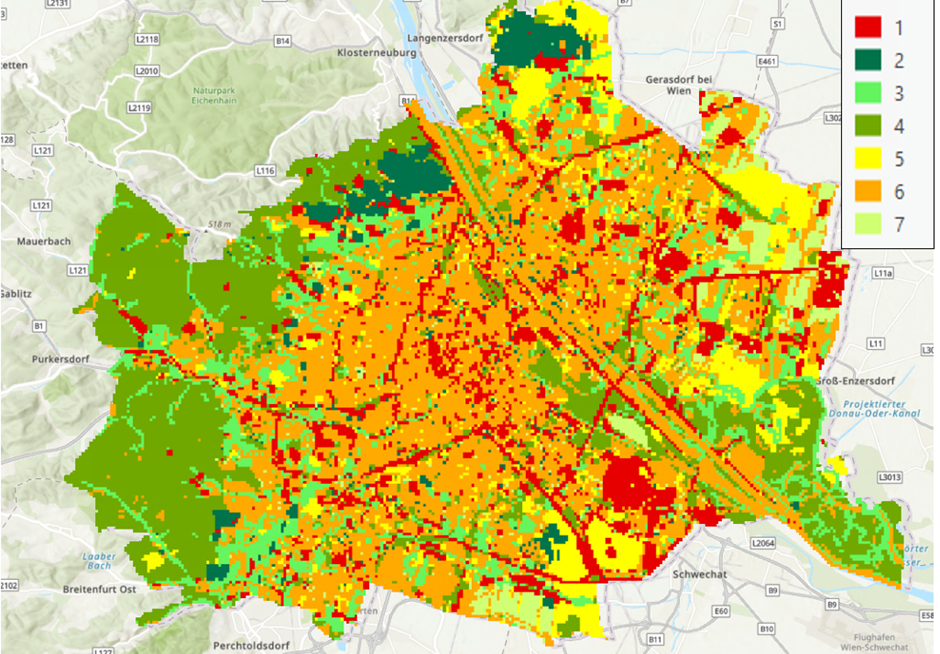
After setting up the data cube with the harmonised data, our initial data exploration involved applying a Principal Component Analysis (PCA) to reduce data complexity. The PCA results were then used as input for an ISO clustering analysis, which identified seven distinct classes with homogeneous data characteristics. For instance:
- Class 6: Sealed urban areas with buildings.
- Class 4: Green, tree-covered urban areas at higher altitudes (somewhat cooler climatically).
- Class 3: Green urban areas without trees.
- Class 5: agricultural areas
Our ongoing efforts aim to refine this classification function further, potentially by increasing the number of classes or modifying the input data selection.
The next steps in our research include developing an urbanity indicator, continuing with PCA, and predicting the presence or density of Drosophila. This work underscores the potential of harmonized geospatial data in advancing our understanding of urban ecology and aiding in the development of sustainable urban environments.